Vercel is a wonderful service with a few short comings. They provide literally free website hosting with an powerful and easy NextJs framework.
If you have a ton of usage it's no longer free, but it's still incredibly inexpensive (think ~$200/mth for 1M visitors).
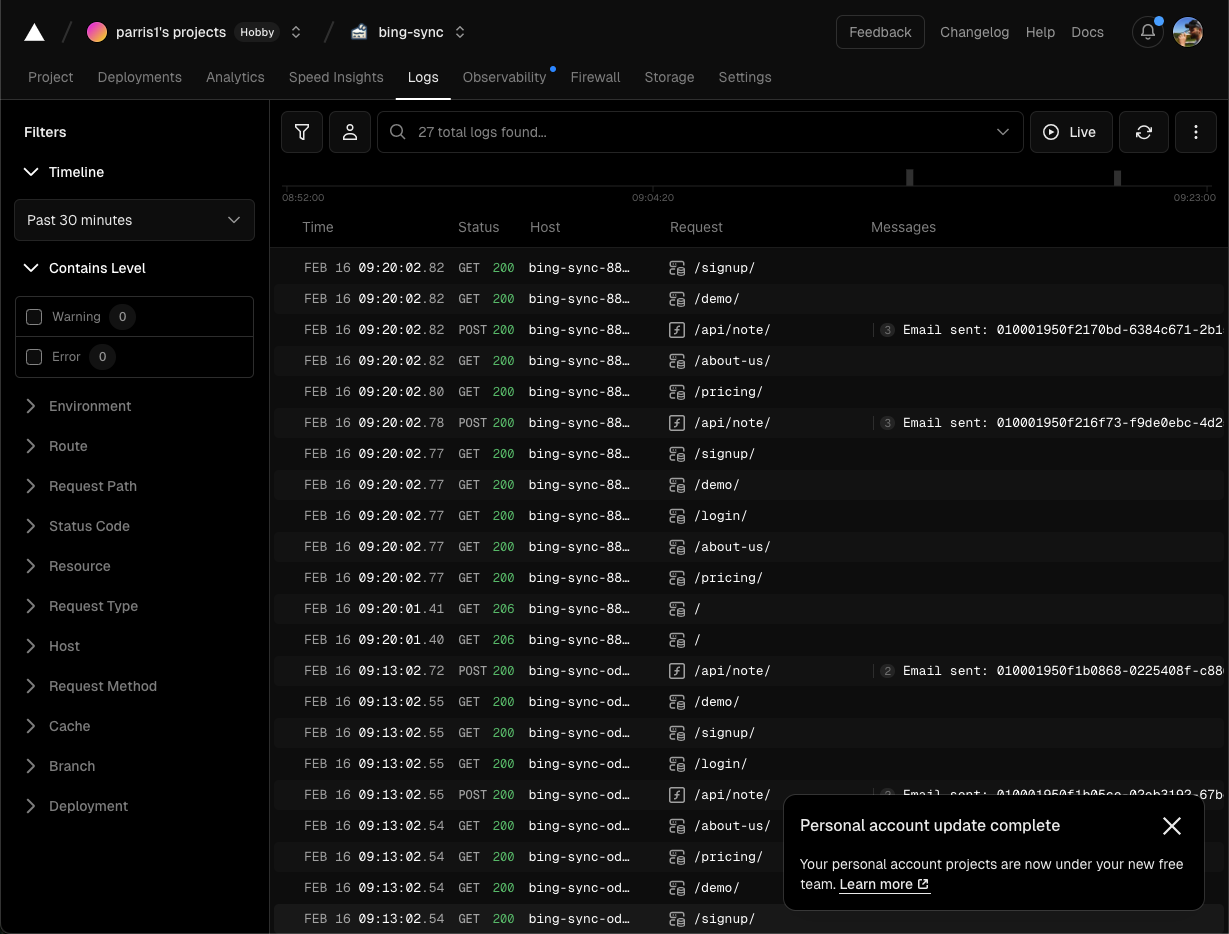
The built in logging tool is essentially a web view of stdout.
If you're on free tier screwing around on a hobby project then this is perfectly suitable.
If you're trying to launch something to the world, then you probably need something a little more.
If you pay Vercel, they provide log drains that connect to your favorite log collection system (assuming your favorite is one of two or three supported).
They roll your entire request into one log before draining, so it's easy to understand the entirety of what happened.
Unfortunately they limit the log to something like 4k bytes. And instead of giving you a second log for the overflow, they simply truncate the beginning parts.
Also again, you have to use their paid tier for this functionality.
Datadog get a lot of flack for being a super aggressive sales org, and for having worst in class documentation.
I don't know about the former, but can vouch for their awful documentation (hence this post).
Either way, they've got a useful service that can be really cheap if you know what you're doing. If you just want searchable logs with alerts, then you're talking about $2/mth or less.
Okay the entire setup is not free, but the log drains themselves are.
This one neat trick that Vercel hates is…
Log using the Datadog client/server packages.
Firstly, setup a client token in your org settings.
The package to install is @datadog/browser-logs.
There are a few gotchas that are explained as comments in the code sample below.
yarn add @datadog/browser-logs
The create a client with a similar API as console
import { datadogLogs } from '@datadog/browser-logs'

/**
 * Create an initializer/singleton to avoid warning
 * messages around double client initialization
 */
let initialized = false
init()

export function init() {
  if (initialized) {
    return
  }

  datadogLogs.init({
    // This is client code, so you need a
    // NEXT_PUBLIC_ environment variable, or
    // you can just hardcode your token.
    clientToken: process.env.NEXT_PUBLIC_DATADOG_BROWSER_CLIENT_TOKEN!,

    // This is your datadog site, NOT your website.  It
    // can be found by logging into datadog logs section.
    site: 'us5.datadoghq.com',

    // Configure like this to see logs in the console as well
    forwardErrorsToLogs: true,
    forwardConsoleLogs: 'all',
    sessionSampleRate: 100,
    storeContextsAcrossPages: true,
  })
}

/**
 * You can pass a context object that creates searchable
 * facets in Datadog, it's pretty handy
 */
export function debug(msg: string, context?: any) {
  datadogLogs.logger.debug(msg, {
    ...context,
    host: process.env.NEXT_PUBLIC_OAUTH_BASE_URL_CALLBACK,
    service: 'browser',
  })
}

export function info(msg: string, context?: any) {
  datadogLogs.logger.info(msg, {
    ...context,
    host: process.env.NEXT_PUBLIC_OAUTH_BASE_URL_CALLBACK,
    service: 'browser',
  })
}

export function warn(msg: string, context?: any) {
  datadogLogs.logger.warn(msg, {
    ...context,
    host: process.env.NEXT_PUBLIC_OAUTH_BASE_URL_CALLBACK,
    service: 'browser',
  })
}

export function error(msg: string, context?: any) {
  datadogLogs.logger.error(msg, {
    ...context,
    host: process.env.NEXT_PUBLIC_OAUTH_BASE_URL_CALLBACK,
    service: 'browser',
  })
}

/**
 * I personally keep log() to the same API as
 * console, where you can pass it any amount of
 * parameters.
 */
export function log(...message: any[]) {
  message.forEach((m) => {
    datadogLogs.logger.debug(m, {
      host: process.env.NEXT_PUBLIC_OAUTH_BASE_URL_CALLBACK,
      service: 'browser',
    })
  })
}
You'll need an API Key this time.
Install Winston logger to forward logs to Datadog via HTTP
yarn add winston
import { createLogger, format, transports } from 'winston'

/**
 * Create an initializer to avoid duplicate initialization
 * errors
 */
let logger: any
let initialized = false

const init = () => {
  if (initialized) {
    return
  }

  logger = createLogger({
    exitOnError: false,
    format: format.json(),

    transports: [
      // Configure to log to console as well
      new transports.Console(),

      // Configure to log to Datadog via HTTP
      new transports.Http({
        // This is wrong in the docs, you need the `us5` type site
        // before the domain
        host: 'http-intake.logs.us5.datadoghq.com',
        path: `/api/v2/logs`,
        ssl: true,
        headers: {
          'DD-API-KEY': process.env.DATADOG_SERVER_API_KEY,
          'Content-Type': 'application/json',
        },
      }),
    ],
  })
}
init()

export function debug(msg: string, context?: any) {
  logger.debug(msg, {
    ...context,
    host: process.env.NEXT_PUBLIC_OAUTH_BASE_URL_CALLBACK,
    service: 'api',
  })
}

export function info(msg: string, context?: any) {
  logger.info(msg, {
    ...context,
    host: process.env.NEXT_PUBLIC_OAUTH_BASE_URL_CALLBACK,
    service: 'api',
  })
}

export function warn(msg: string, context?: any) {
  logger.warn(msg, {
    ...context,
    host: process.env.NEXT_PUBLIC_OAUTH_BASE_URL_CALLBACK,
    service: 'api',
  })
}

export function error(msg: string, context?: any) {
  logger.error(msg, context)
}

export function log(...message: any[]) {
  message.forEach((m) => {
    logger.debug(m)
  })
}
If you want to debug the connection
curl -X POST "https://http-intake.logs.us5.datadoghq.com/api/v2/logs" \
-H "Content-Type: application/json" \
-H "DD-API-KEY: ..." \
-d '[{ "message": "Test log", "host": "localhost", "service": "api" }]'
And that's really it. When setting this up it took probably more than an hour to troubleshoot the "site" and the "host" strings in the two loggers.